Each analysis states its configuration and evidence type. Reproducing arithmetic checks a calculation step; it does not validate its geometry, assumptions or hardware. Supporting spreadsheets retain their original formulas, labels and stored values.
A01 — Drag and thrust sizing
Evidence type: analytical predictions and source-stored workbook values. Configuration: historical diver models used for V1 sizing, not measured V4 hardware output.
The team estimated the force required at 1.4 m/s, then considered acceleration and opposing-current cases. For its straight-line balance, thrust equals modeled drag at constant speed; acceleration adds an inertial term:
Here and are newtons; is fluid density in kg/m³; is dimensionless; is the chosen reference area in m²; is speed relative to fluid in m/s; is the modeled mass in kg; is m/s²; and is seconds. The drag coefficient must accompany its reference area and flow/model conditions. The equation form and importance of area convention are explained by NASA’s drag reference.
Early triangular model
Thrust Calculation.xlsx uses density 1023 kg/m³, , speed 1.4 m/s, triangle height 0.381 m and shoulder-width sweep 0.3566–0.6106 m. Its annotations “14 in” and “15 in” do not match the numerical height/starting width. The calculations below follow the numeric cell inputs; their physical dimension basis remains unresolved. Fluid workbooks
For the first width:
For the last width, m² and N. These steps reproduce the stored endpoint values. The analysis narrative instead reports 44.1–73.5 N, which differs from the reproduced endpoints. CFD/analysis report
The acceleration cells use zero initial speed and 5 s to reach 1.4 m/s, giving 0.28 m/s². At the first row’s mass 72 kg, the inertial contribution is 20.16 N; adding the above drag gives 63.7471 N. At 117 kg and the last area it gives 107.3934 N. The narrative reports 63.7–112.8 N, so the high-end narrative result is not reconciled with these workbook inputs. The workbook lists 18 kg of scuba gear but the cited acceleration formula multiplies the row mass directly; whether that mass already includes gear is unresolved.
Refined area and coefficient variants
The revised workbooks replace the triangle with a rectangle plus one tank circle and two thruster circles:
They use m, tank diameter 0.18415 m and thruster diameter 0.10744 m. At m the pieces are 0.12038816 + 0.02663381 + 2(0.00906613), giving 0.16515423 m². At 0.6106 m the total is 0.25090463 m². Despite the name No Thruster Drag Force.xlsx, its cited revised formula includes both thruster circles. Fluid workbooks
| Source/model | Density (kg/m³) | Area endpoints (m²) | Reproduced/stored constant-speed drag at 1.4 m/s (N) | |
|---|---|---|---|---|
| Thrust Calculation.xlsx · early triangle | 1023 | 0.64 | 0.0679323–0.1163193 | 43.5871–74.6334 |
| No Thruster Drag Force.xlsx · revised area | 1023 | 0.45 | 0.16515423–0.25090463 | 74.5082–113.1939 |
| Book.xlsx · revised area | 1023 | 0.63 | 0.16515423–0.25090463 | 104.3114–158.4714 |
| Analysis narrative · refined summary | Source narrative | Source-selected model | Not fully reconciled to cells | Reported 103.0–161.8 |
For Book.xlsx’s revised acceleration rows, the first value reproduces as 104.3114 + 72(0.28) = 124.4714 N; the last is 158.4714 + 117(0.28) = 191.2314 N. The narrative reports 122.6–191.2 N. No Thruster’s acceleration block instead retains triangular areas and static results, including 49.4451 N at its first row; it should not be read as a consistent updated model merely because its constant-speed section is refined.
Both revised workbooks label an opposing-current scenario 1.7 m/s but use a relative-speed input of 2.8 m/s and retained triangular areas. The heading and input do not reconcile with adding 1.4 and 1.7 m/s. Those current-case values are historical source outputs with an unresolved load basis.
Unit corrections and practical limits
No Thruster’s L column is headed lbf but divides newtons by 9.81, producing a kgf-style conversion; its M column is headed kg but multiplies newtons by approximately 0.224809, producing lbf. Book’s L/M formulas correspond to lbf/kgf. In both revised files the AE:AO speed-sweep headings say N although the data formulas divide by 9.81; their calculated force values are in kgf under that approximate conversion convention. Mass is kg; force is N, lbf or kgf. The early workbook’s force columns labeled kg are likewise force conversions, not measured masses.
This comparison checks selected arithmetic and units only. The varying coefficients, area conventions, gear/mass basis, acceleration geometry, current scenario and source summaries remain unresolved. The coefficients were research/model choices; absence of ambient current or waves does not by itself establish the laminar flow setting used by the team. These predictions support design exploration and D04, with physical verification still in T05.
A02 — CFD modeled diver drag
Evidence type: source-reported computational-fluid-dynamics result. Configuration: historical modeled diver, not a thruster test.
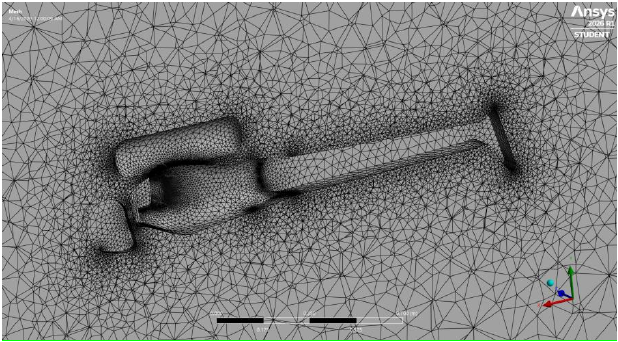
The supplied Ansys analysis describes the following setup and output. Analysis report
| Field | Source-reported value |
|---|---|
| Geometry | SolidWorks model of a 5 ft 9 in diver |
| Domain | 7 m³ boundary volume |
| Mesh | 3 mm mesh-size setting |
| Fluid | Seawater, density 1025 kg/m³; dynamic viscosity Pa·s, at a reported 20°C |
| Velocity | 1.4 m/s along the diver’s longitudinal axis |
| Flow setting | Laminar, as reported |
| Iterations | 300 |
| Output | 99 N modeled drag; |
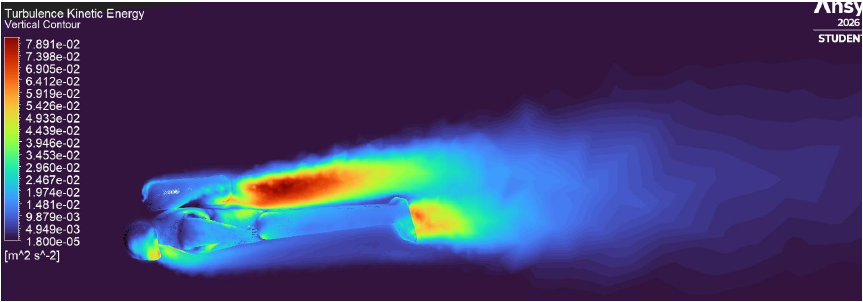
The source compares the coefficient to 0.63 from its analytical work. The relative difference using 0.63 as denominator is about 3.17%, consistent with the source’s “less than 5%” statement. This checks that numerical comparison, not the simulation. A visualization is described as turbulence even though a laminar solver setting is reported. Complete boundary-condition definitions, reference-area basis, convergence criteria, mesh independence and native-case verification are not established by the narrative/screenshots.
The governing research relation is dimensionless, with characteristic length in meters and dynamic viscosity in Pa·s. NASA’s Reynolds-number reference explains the similarity parameter. The archive does not provide a fully reconciled Reynolds analysis supporting the team’s laminar assumption. Agreement between model coefficients is a comparison between models; the 99 N result is not physically measured diver drag, available thruster thrust or whole-system validation. T01, T05
Source mesh
Source flow visualization
A03 — Historical supplier comparison
Evidence type: dated team-reported supplier claims, not matched test results.
The April comparison selected CubeMars W30 for size, in-water weight and integration considerations as well as thrust. Its table lists 65.7–75.5 N forward thrust per unit; a simple pair sum is 131.4–151.0 N, which overlaps the intended target range but does not prove that the complete target is met under a specified test condition. The table also compares APISQUEEN U10, HobbyWater TD6E-2, TD7Pro, TDS10, TDS10 Pro and TD7, CubeMars SW7/DW10 and Blue Robotics T200/T500. Its historical catalog figures and prices are not specifications of the later installed hardware. Report, Table 14
A later thrust-verification note compares 11.1 lbf for CubeMars with 15.43 lbf per APISQUEEN thruster. The ratio is approximately 39.01% greater claimed force. The note calls this “39% more power,” but power was not the compared quantity. Neither exact APISQUEEN variant nor matching voltage, direction, guarding and test conditions are provided. The earlier U10 alternative therefore cannot identify the V4 bench unit. Thrust note, T05
A04 — Battery, endurance and charging analysis status
Evidence type: historical architecture and photographed battery-label inputs.
The battery changed with the propulsion scope. Capacity and nominal voltage alone are insufficient to reproduce a supported runtime prediction for the new system: the supplied record lacks an accepted operating duty, measured load profile, usable pack energy, efficiency and stopping criterion. There is also no complete new-pack recharge derivation tied to an identified charger. An inherited SD1 prediction cannot establish V4 endurance.
The component record documents the battery label, the requirements table specifies endurance/recharge targets, and T06 describes the needed measurements. A complete endurance, recharge or thermal calculation is not established by the supplied record. Report, GA3
A05 — Pressure, structures and thermal analysis status
Evidence type: proposed analysis and research equations; no established enclosure rating.
The report expresses hydrostatic pressure as
Its symbols are external absolute pressure and surface pressure in Pa, fluid density in kg/m³, gravitational acceleration in m/s² and depth in m. This is the report’s pressure-load relationship, not a completed enclosure-strength calculation. Structural evaluation needs the differential load across the enclosure and its actual geometry/material/seals. The report identifies compression/buckling as work to consider. Report, operating conditions
The available record does not establish tube polymer/wall dimensions, approved print material, seal/groove sizing, an external-pressure buckling assessment, verified finite-element results or completed temperature testing. A material-property table, pressure equation or CAD section alone cannot establish the depth target. System uncertainties, T03, T06
A06 — PETG coupon shrinkage and coating arithmetic
Evidence type: source-recorded coupon dimensions with checked arithmetic. Configuration: undated PETG reference coupon; not a qualified enclosure.
The handwritten notes record the dimensions below against a nominal 1 in reference along the three compared axes. Coupon notes
| Axis | Uncoated dimension (in) | Coated dimension (in) | Shrinkage versus 1 in | Calculated compensating CAD/slicer scale |
|---|---|---|---|---|
| X | 0.9955 | 1.0010 | 0.45% | 100.4520342% |
| Y | 1.0000 | 1.0065 | 0% | 100% |
| Z | 0.9995 | 1.0050 | 0.05% | 100.0500250% |
For a nominal dimension and uncoated recorded dimension , the notes’ calculation is
For X: , then . This independently reproduces the scale arithmetic. It does not establish a repeatable printer compensation for other parts or materials.
The coating differences are 0.0055 in in X, 0.0065 in in Y and 0.0055 in in Z. The original X subtraction says 0.0045 in; the correct subtraction is in. The source’s original mean 0.0055 in and half-thickness 0.00275 in follow the erroneous input. Using the corrected differences:
If coating were symmetric on opposing faces, half that dimension increase would be 0.0029167 in per side. Symmetry is an assumption, not an observed coating profile. The notes mix “normal nail polish” and “gel coating,” with no established product, layer process, instrument, resolution, repeat count or test date. These values describe one source record and an arithmetic correction; they are not a universal coating allowance or waterproofing result. Applying them to PLA or an enclosure seal would require new evidence. T03
A07 — Routing and decision-score arithmetic
Evidence type: estimated body routes and recorded timing inputs used for historical selection.
The cable workbook estimates battery routes of 65 in side tank, 60 in front waist and 75 in back waist. Multiplying by 0.0254 gives 1.651, 1.524 and 1.905 m. With source limits 2 m maximum, 1.5 m minimum and 25 available points, its lower-is-better score is
Side-tank arithmetic gives ; front/back give 23.80 and 4.75. These reproduce the stored values used in D03. The chosen denominator and routes are assumptions; they do not measure actual snag probability. Routing workbook
The same workbook estimates propulsor routes of 57.5 in for top tank and 68 in for thigh/side tank, giving 1.4605 and 1.7272 m. Its 20-point normalization against 2 m and 1.4605 m gives 20 and 10.1131. Control routes assuming thigh propulsion are 94 in forearm, 32 in waist and 97 in dive watch, giving 2.3876, 0.8128 and 2.4638 m. Using limits 2.6 and 0.2 m with 15 points gives 1.3275, 11.17 and 0.85125. These are checked route arithmetic, not installed cable measurements.
Book1.xlsx supplies three timing inputs per propulsor position. The displayed units are not established by the cells, so the table preserves them as source timing values rather than measured shutdown latency:
| Position | Trial 1 | Trial 2 | Trial 3 | Reproduced mean | Reproduced score, 20 points, limits 5 and 2.5 |
|---|---|---|---|---|---|
| Top tank | 3.48 | 3.09 | 3.35 | 3.3067 | 13.5467 |
| Thigh | 4.10 | 3.64 | 3.78 | 3.8400 | 9.2800 |
| Side tank | 4.30 | 4.50 | 4.73 | 4.5100 | 3.9200 |
The top-tank report score is 13.5 rather than the full computed 13.5467. The battery timing block reuses the 3.48/3.09/3.35 set, adds waist values 2.11/2.10/1.87 and two-battery values 4.10/3.64/3.78; means 3.3067/2.0267/3.84 produce scores 6.9333/19.7333/1.60 under limits 4 and 2. Timing workbook
The control block repeats 2.03/1.97/1.97 for forearm and the column labeled dive watch; both means are 1.99. The column labeled fanny pack uses 2.11/2.10/1.87, mean 2.0267. Under limits 2.05 and 1.99 these score 20/20 and 7.7778 respectively. The report assigns 7.78 to dive computer and 20 to waist instead. Column-to-option correspondence is therefore unresolved; those workbook trials cannot independently substantiate the report’s option labeling. The report also says five reach trials while the supplied workbook/presentation show three. Report, timing workbook
Subject geometry, timing protocol, sample independence, unit confirmation and original survey responses are missing. The scores support a historical decision account, with discrepancies preserved. Reaching a release is not the same as releasing it, stopping the motor or demonstrating successful emergency removal.